Introduction
When I debug LLM applications, I often want to see the actual HTTP traffic: the request body, model name, tool calls, streaming chunks, token usage, and the final response. SDK logs are useful, but they are usually either too summarized or too noisy.
mitmproxy is great for this because it can intercept HTTP, HTTPS, and WebSocket traffic, then show each flow in mitmweb. The missing piece is presentation: raw JSON is precise, but not pleasant to read when the payload contains long messages or nested tool calls.
That is where Tampermonkey fits nicely. Since mitmweb is just a browser UI, a userscript can enhance the page locally. The setup in this post uses mitmproxy to capture LLM API calls and a Tampermonkey script to render selected JSON responses as a cleaner chat-style view.
What You’ll Get
After the setup, you can:
- intercept LLM API calls without changing application code much, or at all;
- inspect requests, responses, headers, streaming chunks, and errors in real time;
- render large JSON payloads in a readable conversation-oriented layout;
- customize the viewer with plain JavaScript instead of patching mitmproxy itself.
flowchart LR
    app["App / SDK<br/>Browser, CLI, service<br/>base_url or proxy"]
    proxy["mitmproxy<br/>reverse or forward proxy<br/>listen :8080"]
    provider["LLM Provider<br/>OpenAI-compatible<br/>Anthropic / Gemini / ..."]
    web["mitmweb UI<br/>inspect flows<br/>web :8081"]
    tm["Tampermonkey<br/>local userscript<br/>chat-like payload view"]

    app -->|"HTTP(S) API call"| proxy
    proxy -->|"forward request"| provider
    provider -->|"response / stream"| proxy
    proxy -->|"response"| app
    proxy -.->|"captured flows"| web
    tm -.->|"enhances DOM"| web
Figure 1: Architecture: mitmproxy captures the API traffic, while mitmweb and Tampermonkey render a better local viewer.
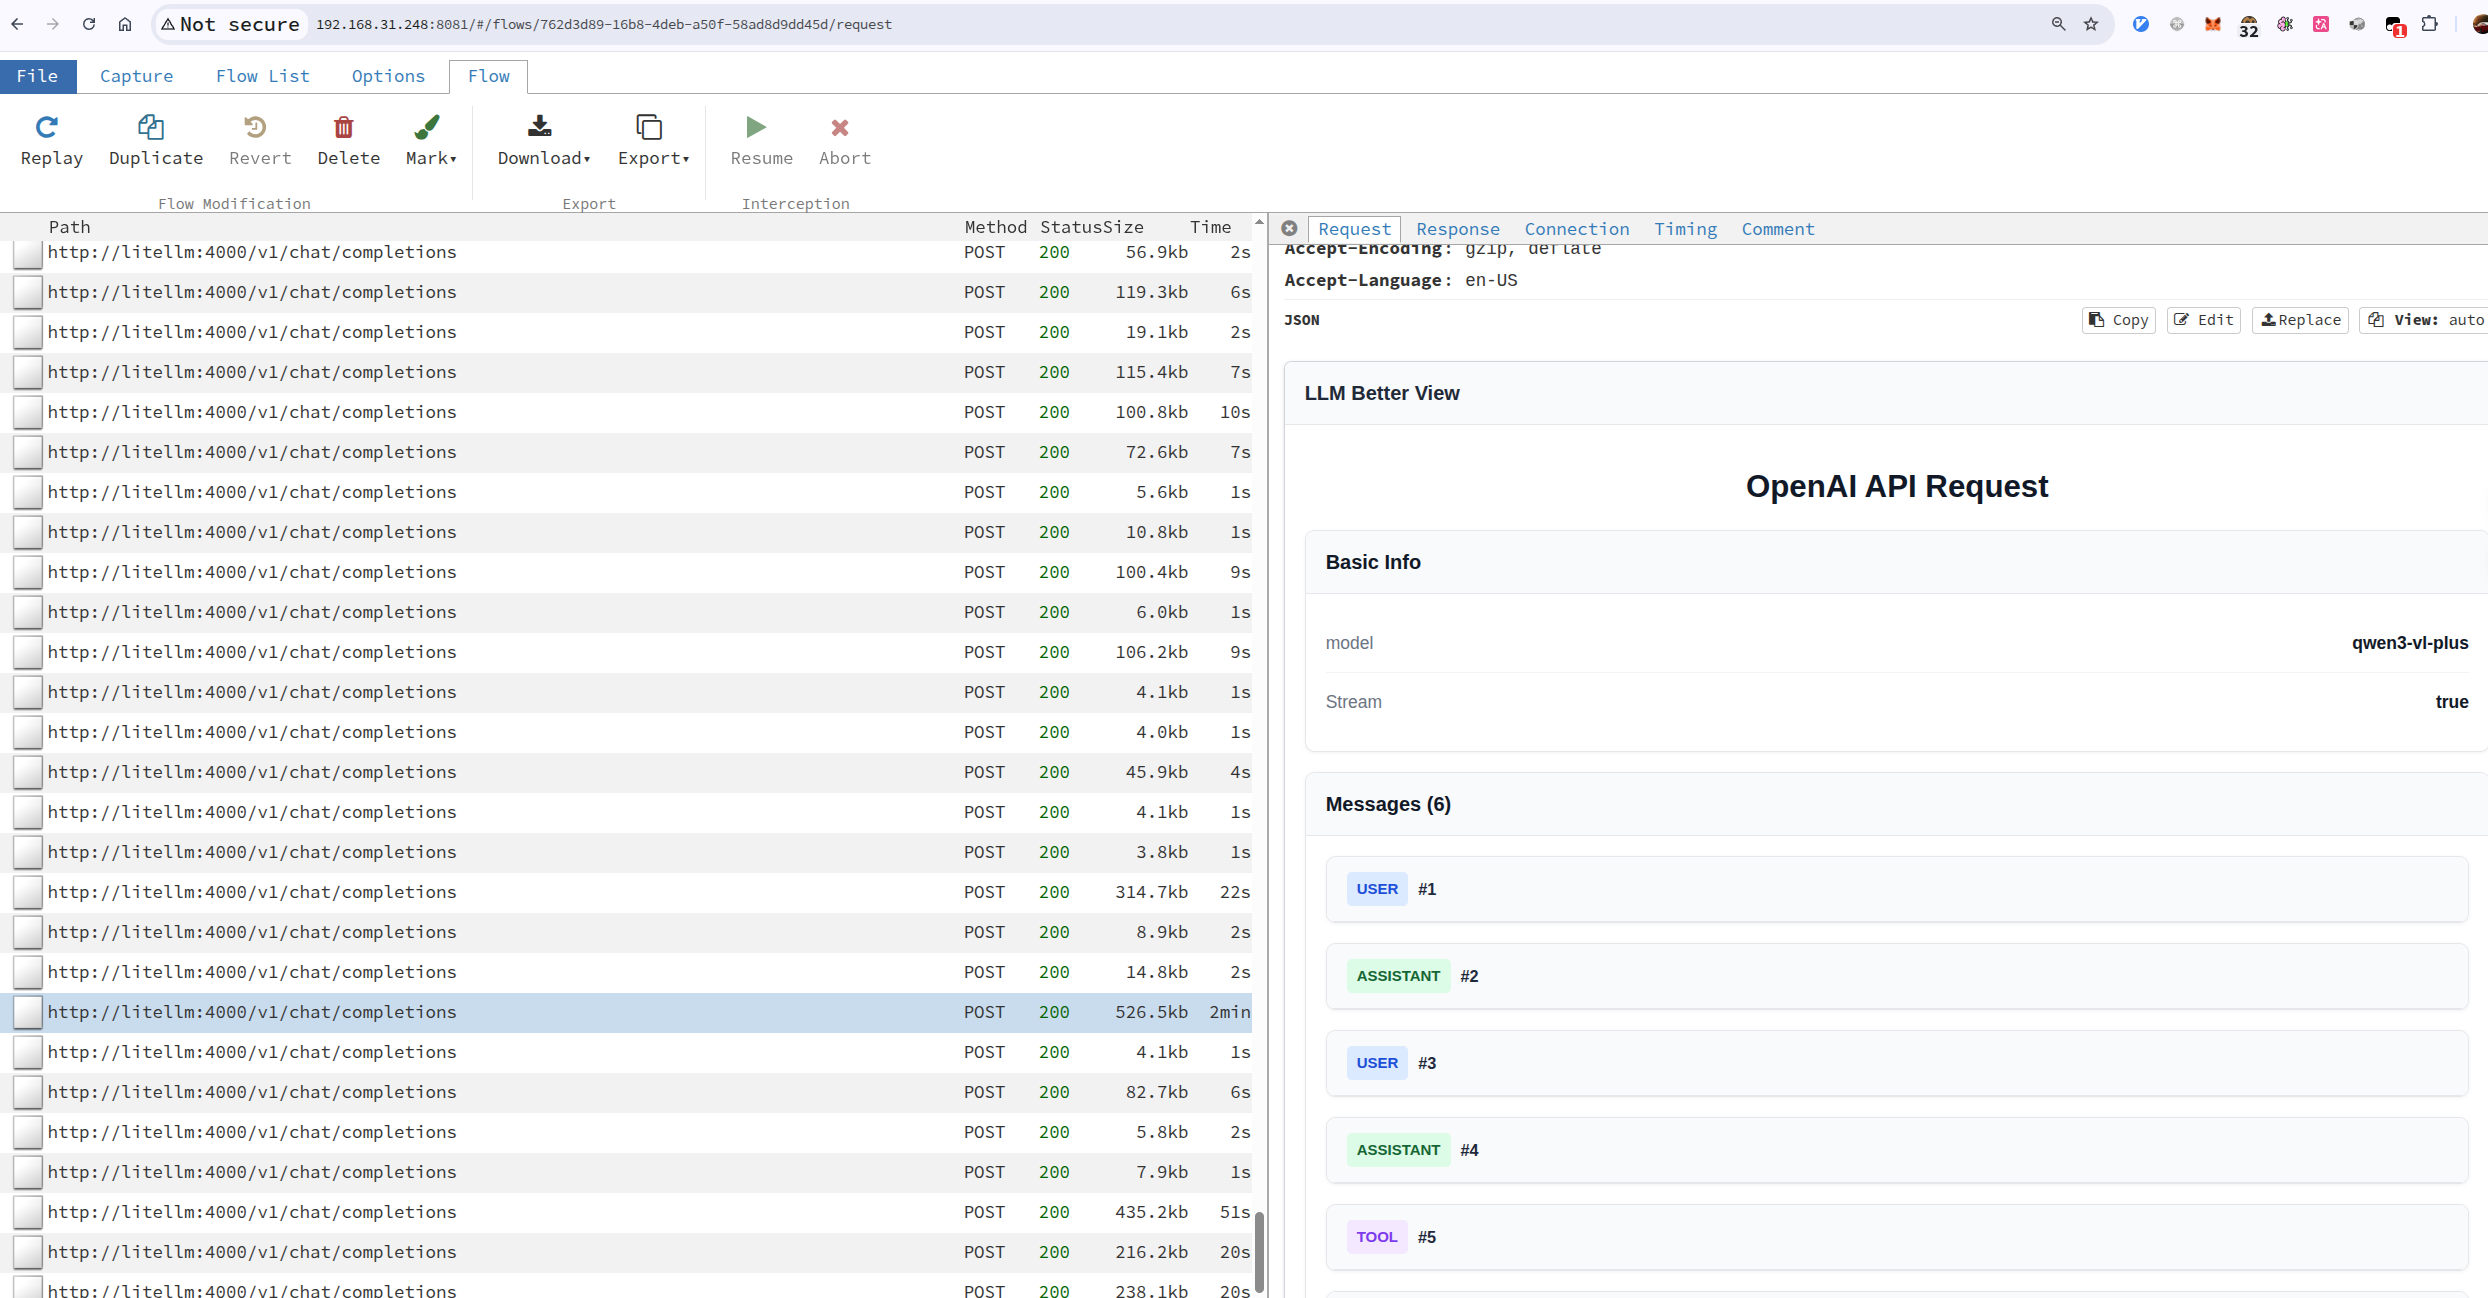
Figure 2: LLM Better View Example
Capture LLM API Calls
There are several ways to put mitmproxy between your application and an LLM provider. The first question I ask is: can I control the client’s network exit point?
| Scenario | Recommended mode | Client configuration | Fit |
|---|---|---|---|
The SDK or gateway can change base_url | reverse proxy | Point the API endpoint at mitmproxy | Best default |
| The CLI, browser, or service can use a proxy | forward proxy | Set HTTP_PROXY / HTTPS_PROXY and trust mitmproxy’s CA | Very common |
| The client cannot be changed at all | transparent proxy | Change routing / NAT / gateway rules | Last resort |
For day-to-day LLM development, I normally start with reverse proxy mode. It is explicit, easy to reason about, and most SDKs let you override the API base URL. If you already run a middle layer such as LiteLLM, Open WebUI, or one-api, reverse proxy mode is even more natural: keep the application pointed at a local gateway, then put mitmproxy in front of that gateway.
Reverse Proxy Mode
Use this when your application or SDK lets you configure an API endpoint, for example base_url in many OpenAI-compatible clients.
In this mode, your app talks to mitmproxy as if it were the API server. mitmproxy forwards the request to the real upstream provider.
| |
Then configure the client to use:
| |
Open mitmweb at:
| |
The important detail is that the @8080 in --mode reverse:https://api.openai.com@8080 is the proxy/API-facing port, while --web-port 8081 is the mitmweb UI port. Keeping the listen port inside --mode is easier to read than using a separate global --listen-port.
If the upstream is an internal service, such as litellm:4000 inside a compose network, you can point the reverse upstream at the service name:
| |
The @4001 part means this reverse mode listens on 4001. The client talks to http://<host>:4001, and mitmproxy forwards the request to http://litellm:4000 inside the container network.
Forward Proxy Mode
Use this when you can configure the browser, terminal, or system proxy. In this mode, the client keeps using the original API URL, but the network traffic is routed through mitmproxy.
| |
Then configure the client to use localhost:8080 as its HTTP/HTTPS proxy. For command-line tools, this is often enough:
| |
HTTP_PROXY / HTTPS_PROXY is not enough by itself. To decrypt HTTPS request and response bodies, the environment that sends the traffic must install and trust mitmproxy’s generated local CA certificate. Otherwise, the client will usually fail certificate validation, or mitmproxy will only see the tunnel connection without the plaintext HTTP content inside it.Visit http://mitm.it while routed through mitmproxy to download the certificate for your platform. Install it where the request is actually made: a browser needs the browser or system trust store, a CLI inside a container needs the container image or runtime CA bundle, and tools such as Node or Python may need their own CA configuration pointed at that certificate.
mitmproxy can also run multiple modes at once. The compose example below exposes:
4001: reverse proxy to LiteLLM, useful when an OpenAI-compatible client can changebase_url;8080: regular forward proxy, useful for CLIs or browsers withHTTP_PROXY/HTTPS_PROXY;8081: the mitmweb UI.
Docker Compose Example: LiteLLM + mitmproxy
This is close to the way I deploy it on TrueNAS: LiteLLM provides an OpenAI-compatible API, Postgres persists LiteLLM state, Prometheus keeps metrics, and mitmproxy exposes both reverse proxy and forward proxy entry points.
| |
If you only want to capture requests that go through LiteLLM, configure the client base URL as:
| |
If you want a CLI tool to keep using the original upstream API while routing traffic through mitmproxy, use the forward proxy port:
| |
This forward proxy setup also requires the CLI environment to trust mitmproxy’s CA, otherwise HTTPS API calls will fail at certificate validation.
Then open http://<truenas-or-docker-host>:8081 to inspect flows. Because mitmweb is bound to 0.0.0.0, keep web_password enabled and preferably put it on a trusted LAN or behind another authenticated reverse proxy.
Transparent Proxy Mode
Transparent mode is useful when you need network-level interception and cannot configure the client. It is also the most invasive option, so I only reach for it when reverse or forward proxy mode is not enough.
A minimal Linux sketch looks like this:
| |
This needs root privileges, routing setup, and certificate trust. For local LLM app debugging, reverse proxy mode is usually much calmer.
Install the Tampermonkey Better LLM View Script
I keep the userscript here: mitmproxy-llm-better-view. You can install it directly, fork it, or treat it as a starting point for your own viewer.
The basic steps are:
- Install the Tampermonkey extension in your browser.
- Enable browser support for user scripts if your browser requires it.
- Open
mitmweb-llm-better-view.user.jsand install it in Tampermonkey. - Adjust the userscript
@includeor@matchrule so it matches your mitmweb address, for examplehttp://localhost:8081/*. - Reload mitmweb and select an LLM API flow.
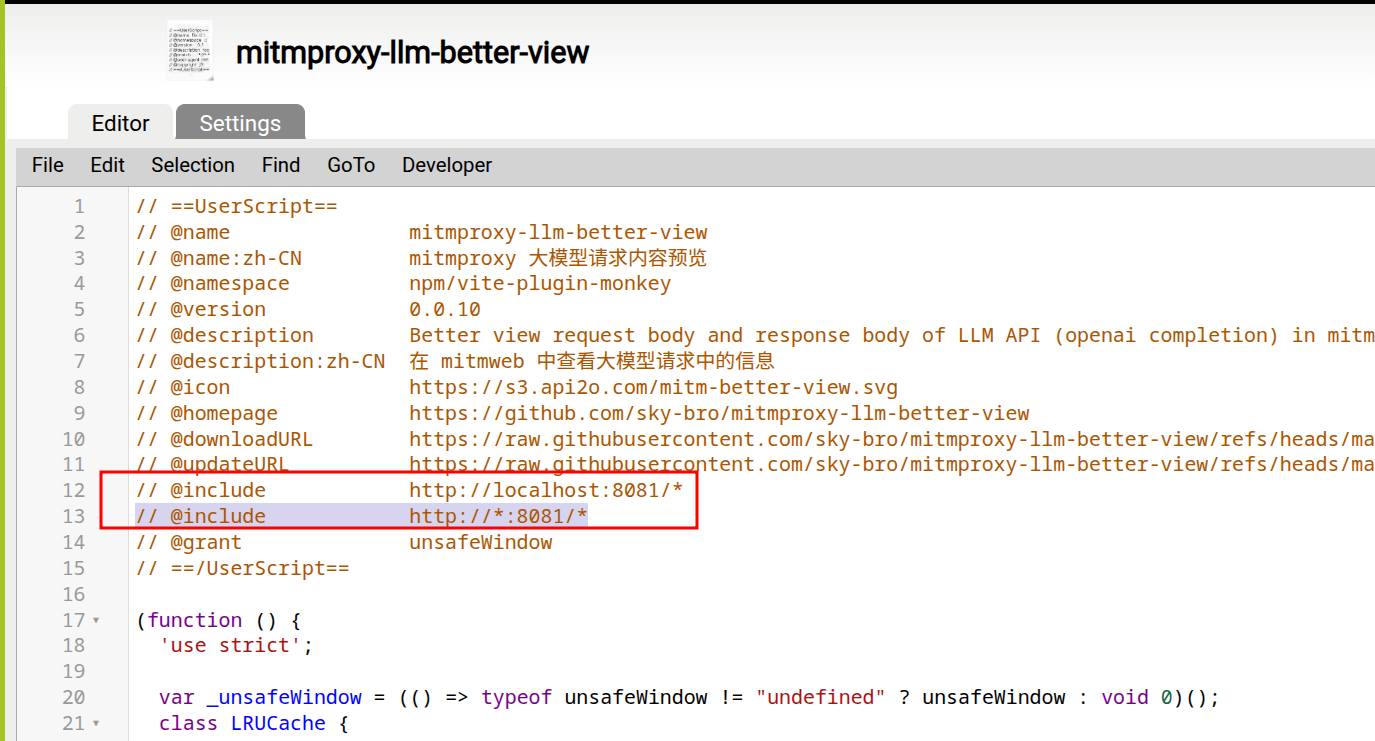
Figure 3: Set the script include rule
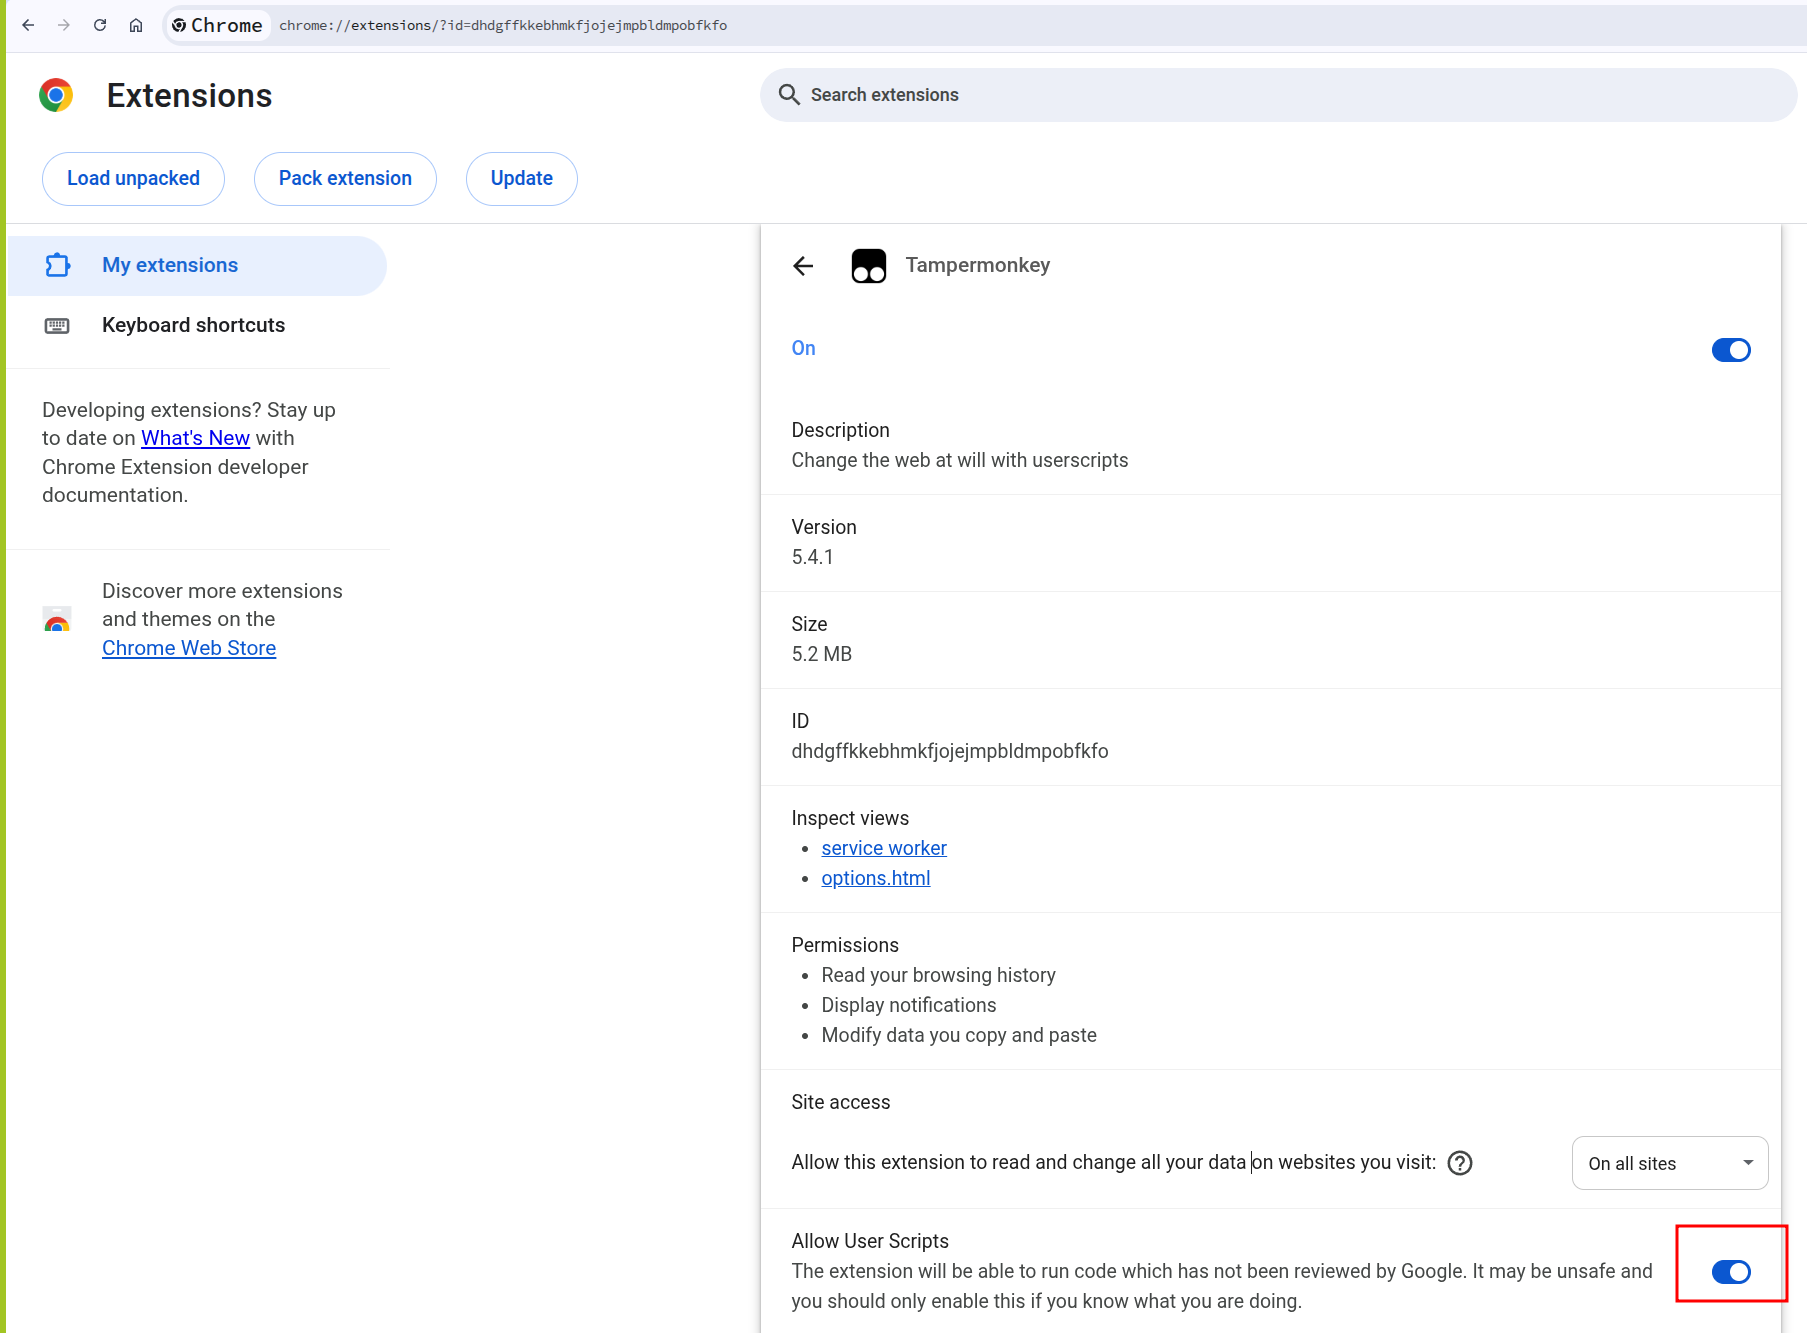
Figure 4: Allow user scripts for Tampermonkey
Once enabled, the script watches mitmweb’s selected flow details and transforms supported LLM JSON payloads into a more readable view. Because this is a userscript, the rendering logic stays local to your browser. You can add provider-specific parsing, hide fields you do not care about, or highlight things like tool calls and token usage.
Practical Notes
A few things are worth keeping in mind:
- Do this only for traffic you own or are allowed to inspect. A MITM proxy can expose secrets, cookies, API keys, and private prompts.
- Use a test API key when possible. Captured requests often include bearer tokens in headers.
- Keep
web_passwordenabled if mitmweb is bound to0.0.0.0, or bind it to127.0.0.1if you only need local access. - If a client refuses the proxy certificate, check whether it uses its own CA bundle or certificate pinning.
- For streaming responses, you may need to inspect both the raw event stream and the reconstructed body, depending on the provider and client.
Advanced: Clean Up Captured History with an Addon
mitmproxy supports Python addons. An addon is useful when you want the capture list to stay focused while you work.
For example, this tiny addon keeps only flows whose host looks related to an LLM provider:
| |
Run it with:
| |
That example only marks flows, but the same hook can export selected payloads, redact sensitive headers, or attach metadata that makes the mitmweb list easier to scan.
Conclusion
mitmproxy is already a strong network microscope. Tampermonkey turns its browser UI into a place you can shape for your own workflow.
For LLM debugging, that combination is especially handy: capture the real API traffic, keep the raw request and response available, and render the parts you actually read in a friendlier format. The result is lightweight, local, hackable, and independent of whichever SDK or UI you happen to be debugging that day.